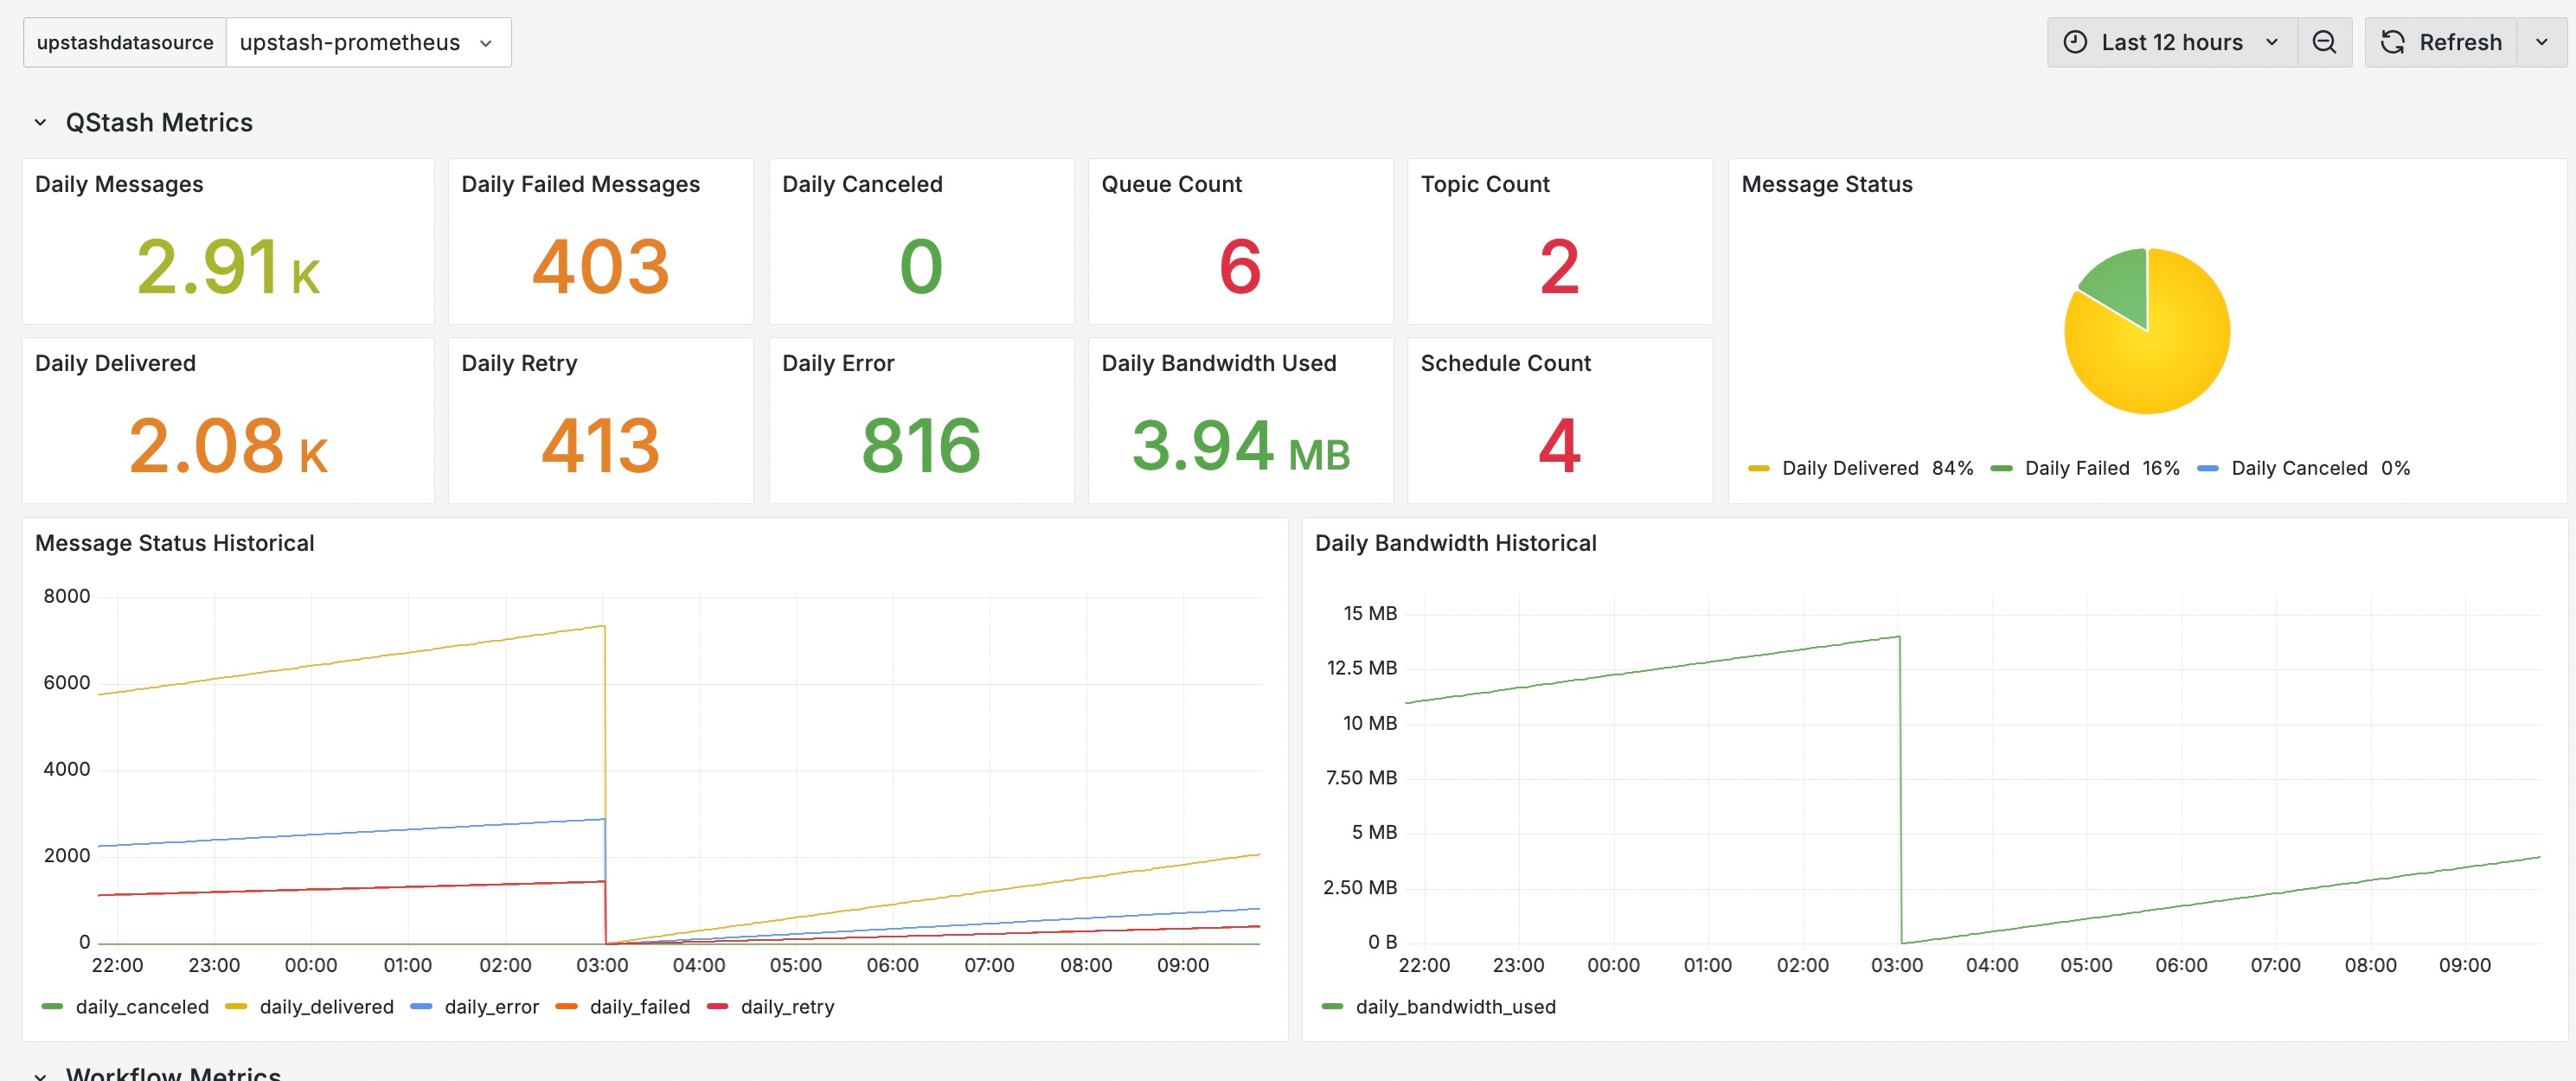
Integration ScopeUpstash Prometheus Integration covers Prod Pack.
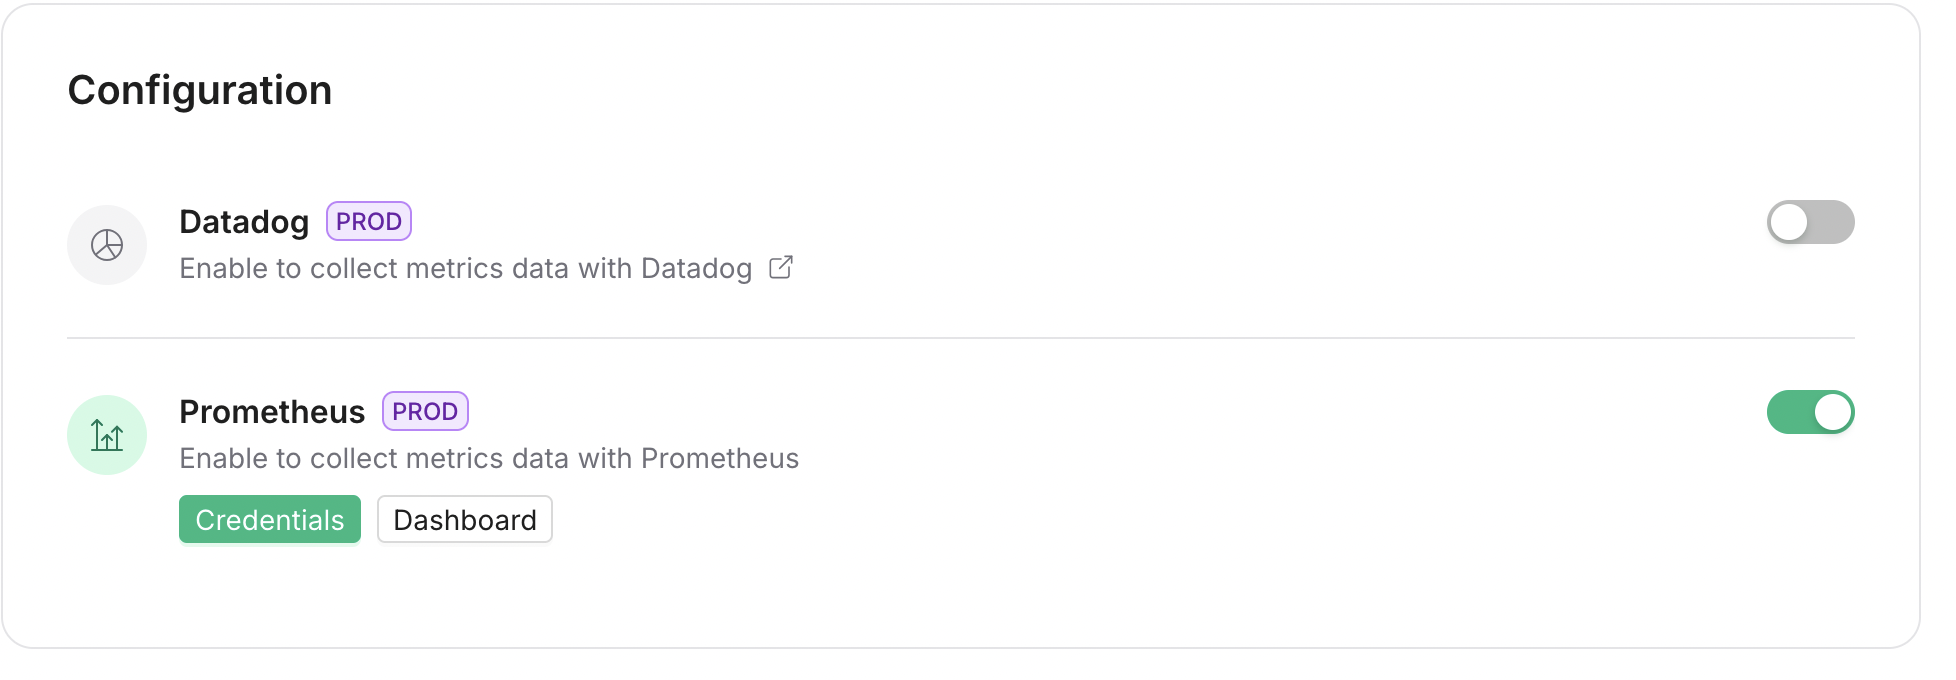
Step 1: Enable Prometheus in Upstash Console
- Open the Upstash Console and navigate to QStash.
- Go to Settings → Monitoring.
- Enable Prometheus to allow scraping QStash metrics.
Step 2: Copy Monitoring Token
- After enabling, a monitoring token is generated and displayed.
- Copy the token. It will be used to authenticate Prometheus requests.
Header FormatSend the token as
Authorization: Bearer <MONITORING_TOKEN>.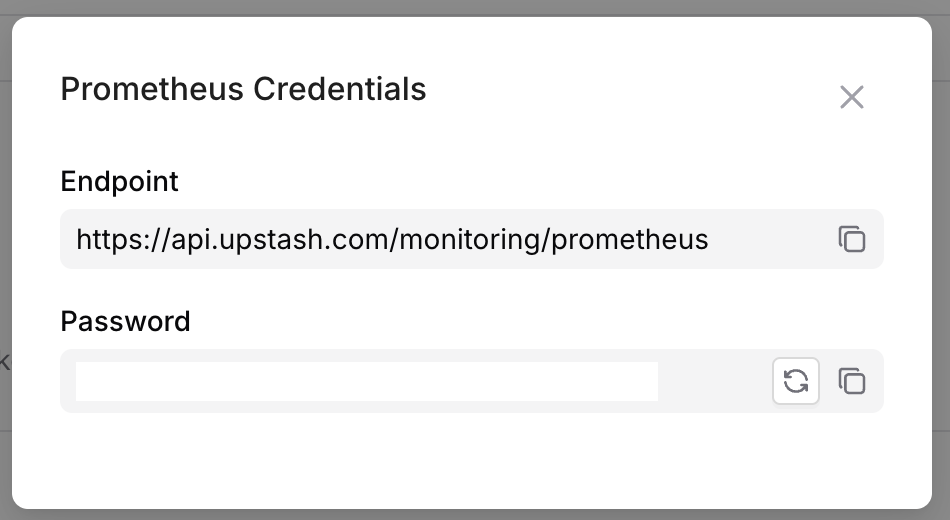
Step 3: Set Up Prometheus Connection
You can point Grafana directly at the Upstash endpoint, or federate QStash metrics into your own Prometheus server.Grafana Data Source Setup
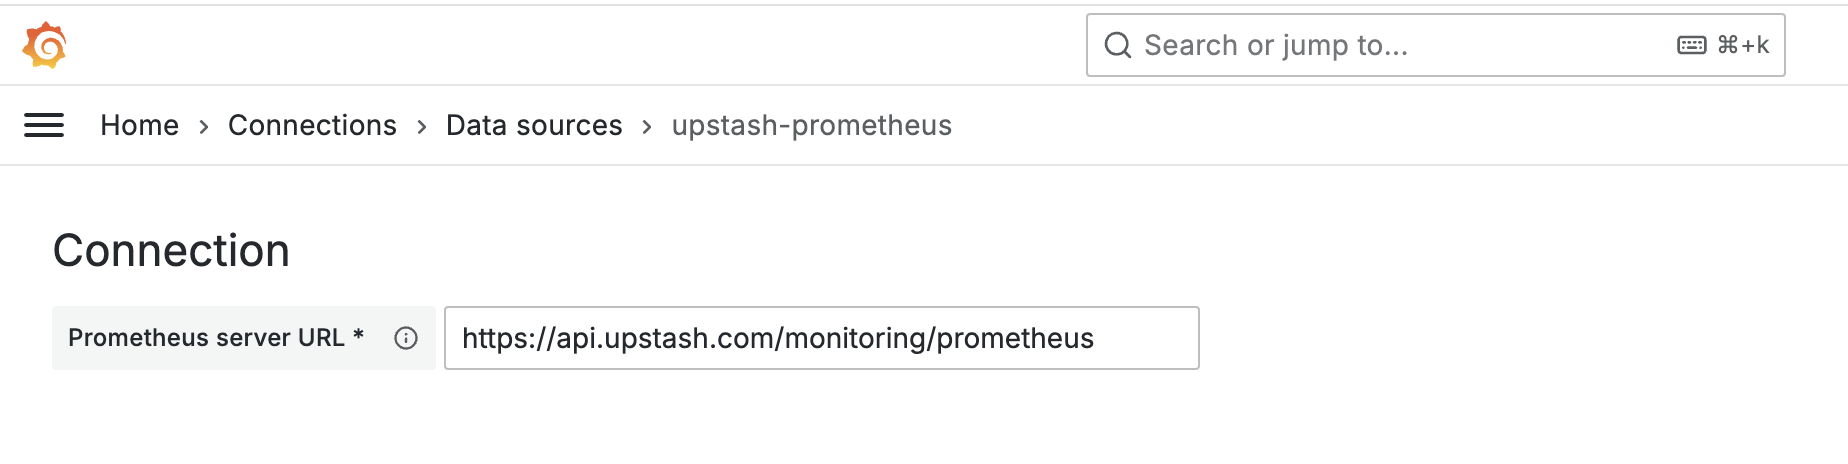
- In Grafana, add a Prometheus data source.
- Set the address to
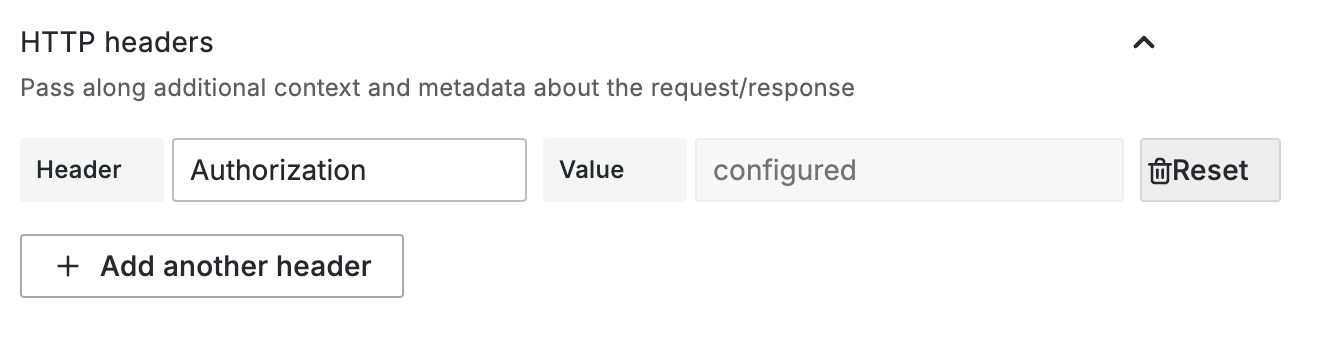
https://api.upstash.com/monitoring/prometheus. - In HTTP headers, add the monitoring token.
Prometheus Federation Setup
Federation lets your Prometheus pull QStash metrics from the Upstash API and store them in your own Prometheus instance, so Grafana can query your Prometheus instead of hitting the Upstash endpoint directly.When to use federation
- You already run Prometheus and want to persist QStash metrics locally.
- You want to control retention, recording rules, or alerts on QStash metrics.
- Add a scrape job to your Prometheus configuration file (
prometheus.yml):
This configuration pulls all QStash metrics. You can adjust the
match[] parameter to filter them:qstash_public_metrics{region="us-east-1"}pulls metrics for QStash in a specific regionqstash_public_metrics{metric_name="dlq_message_count"}pulls a specific metric
- Verify the federation target
- Reload (or restart) your Prometheus server to apply the new configuration.
- Visit Prometheus → Status → Targets and confirm
federate_upstash_qstashis UP.
Step 4: Import Dashboard
You can use the Upstash Grafana dashboard to visualize QStash metrics. Open the import dialog and use: Upstash QStash Dashboard